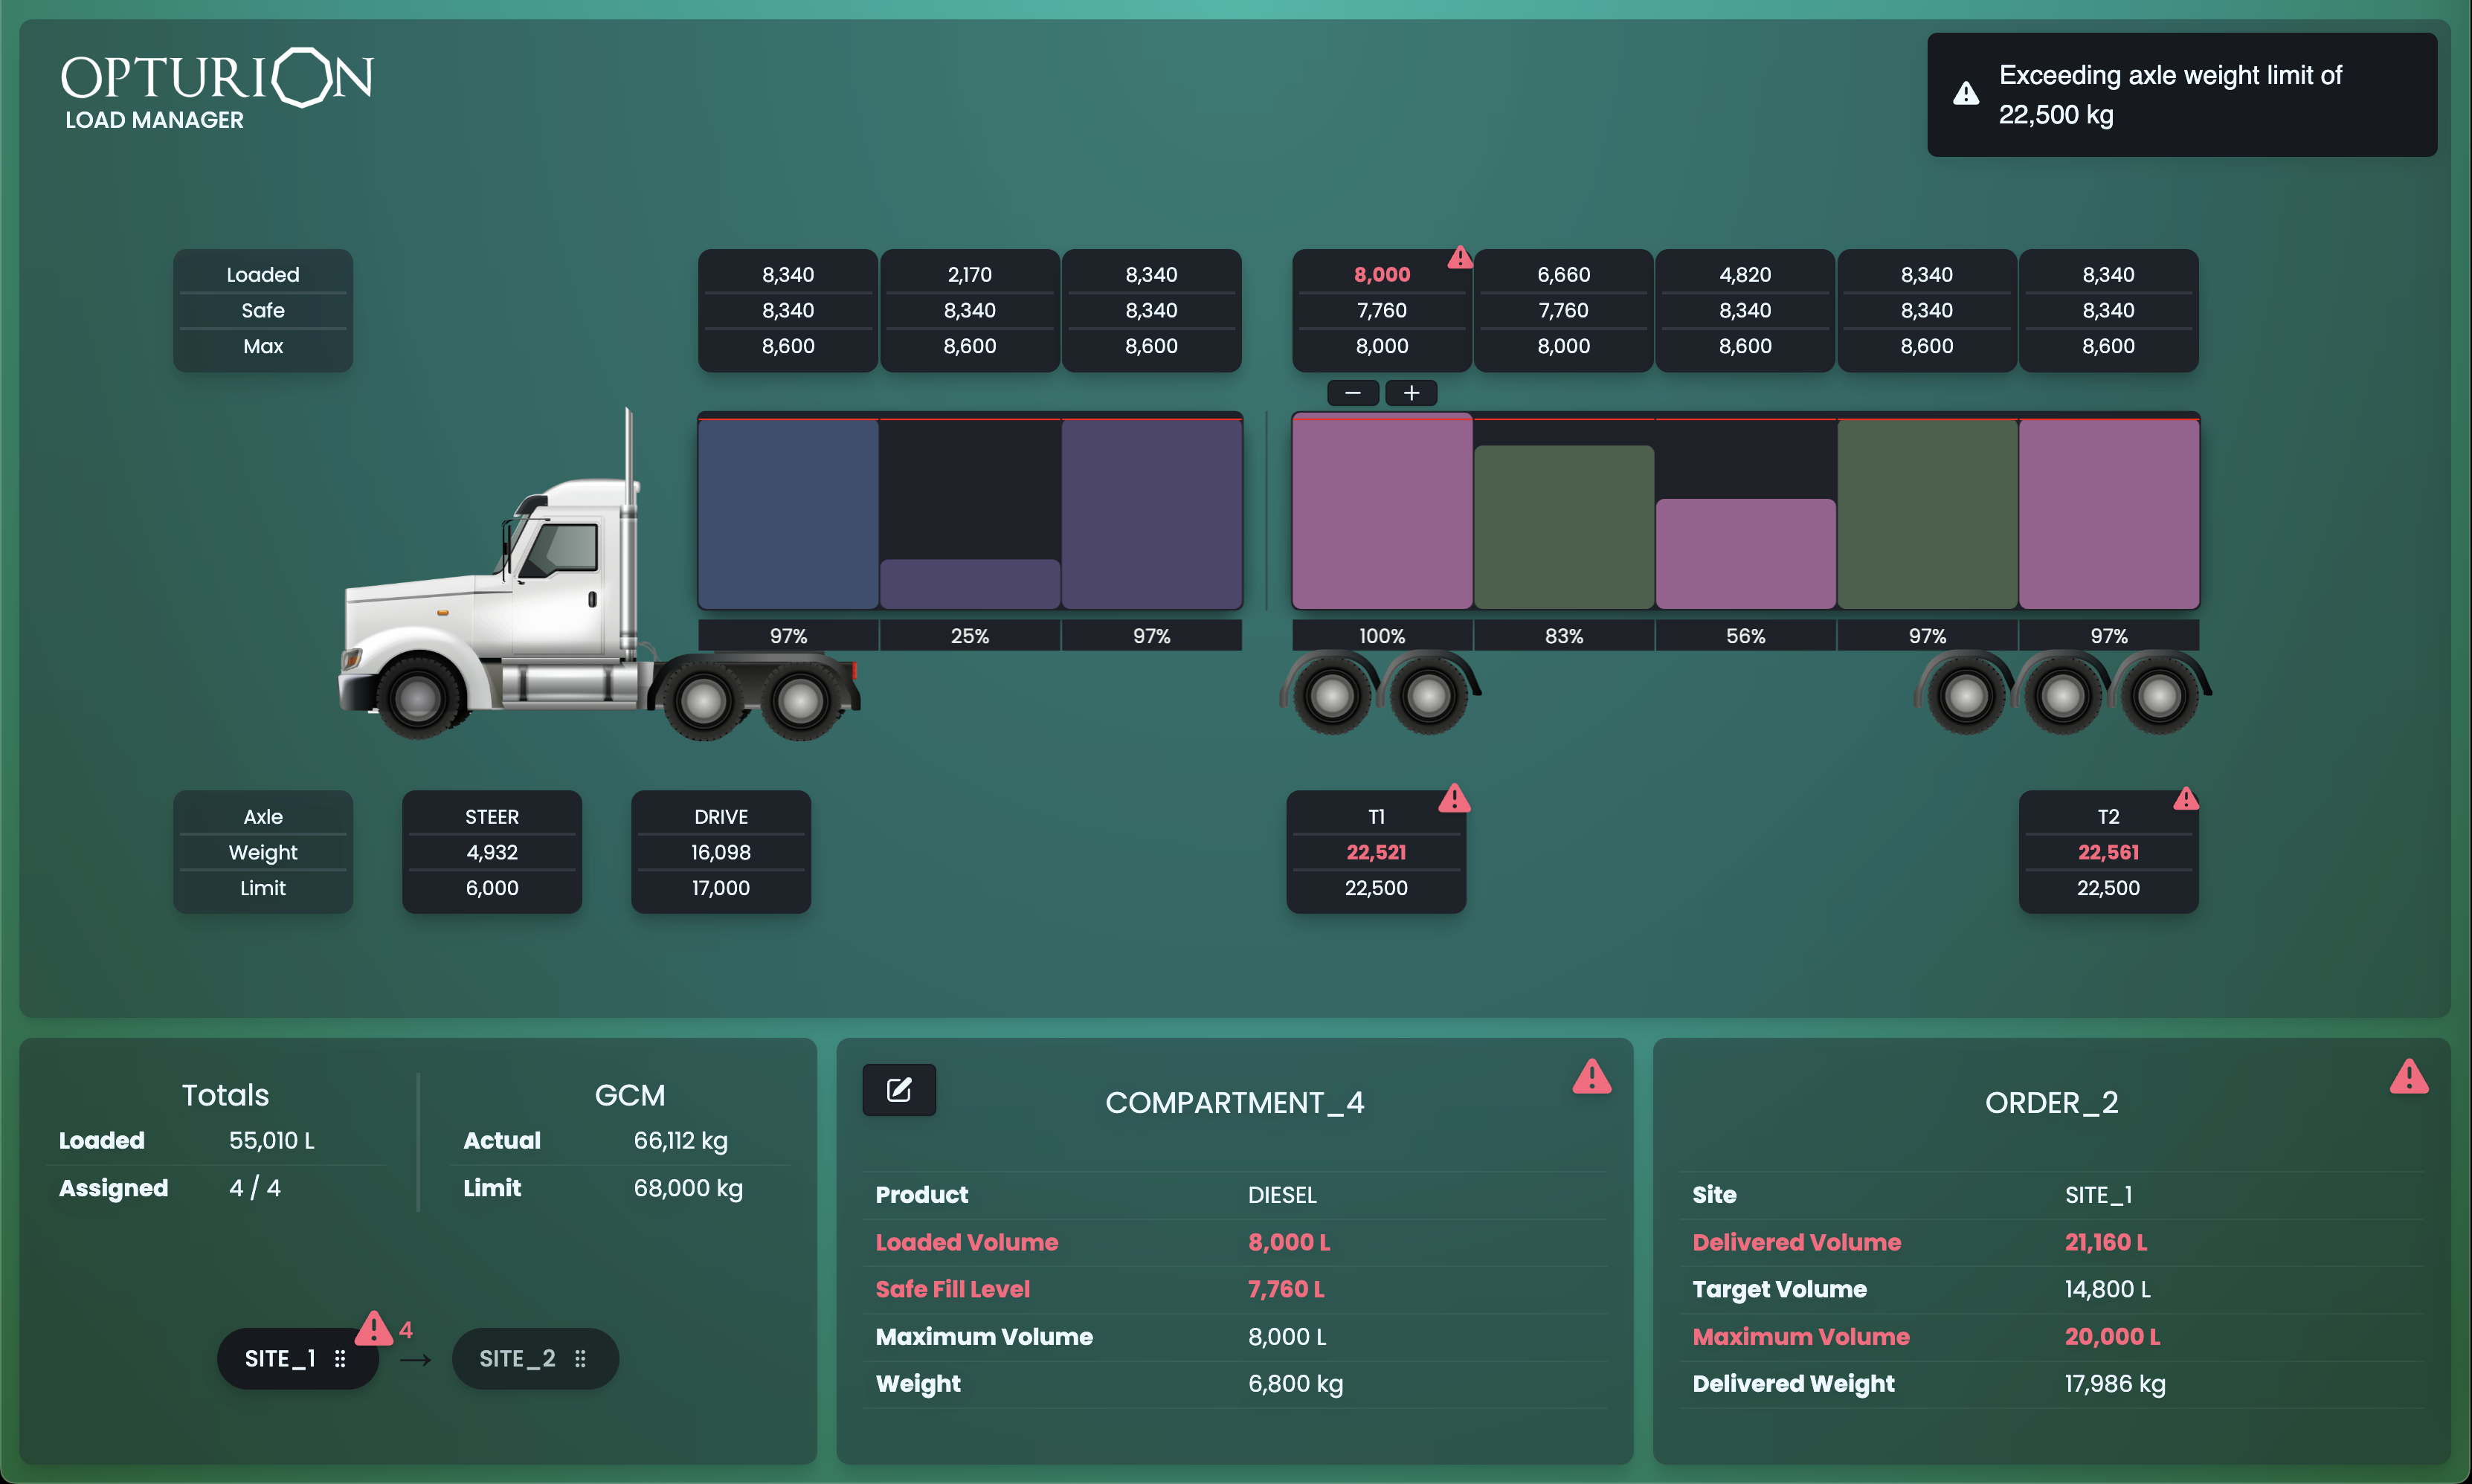
2.1 Dashboard Interface
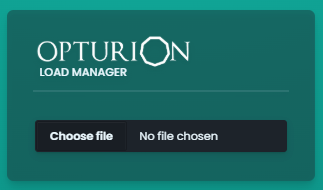
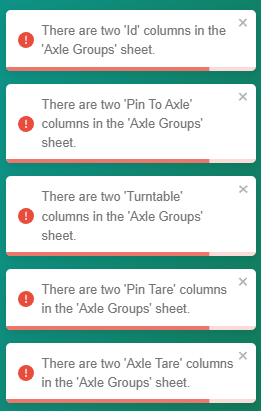
The Choose File button lets you select an OLM-Excel input format to load into the OLM. If this input file contains errors, these will be displayed in the interface. Figure 2 shows an example of input errors.
If a successful upload does not contain assignments, the optimiser runs and a load plan will be displayed as can be seen in Figure 3. Otherwise, the optimiser will check the compliance of those assignments.
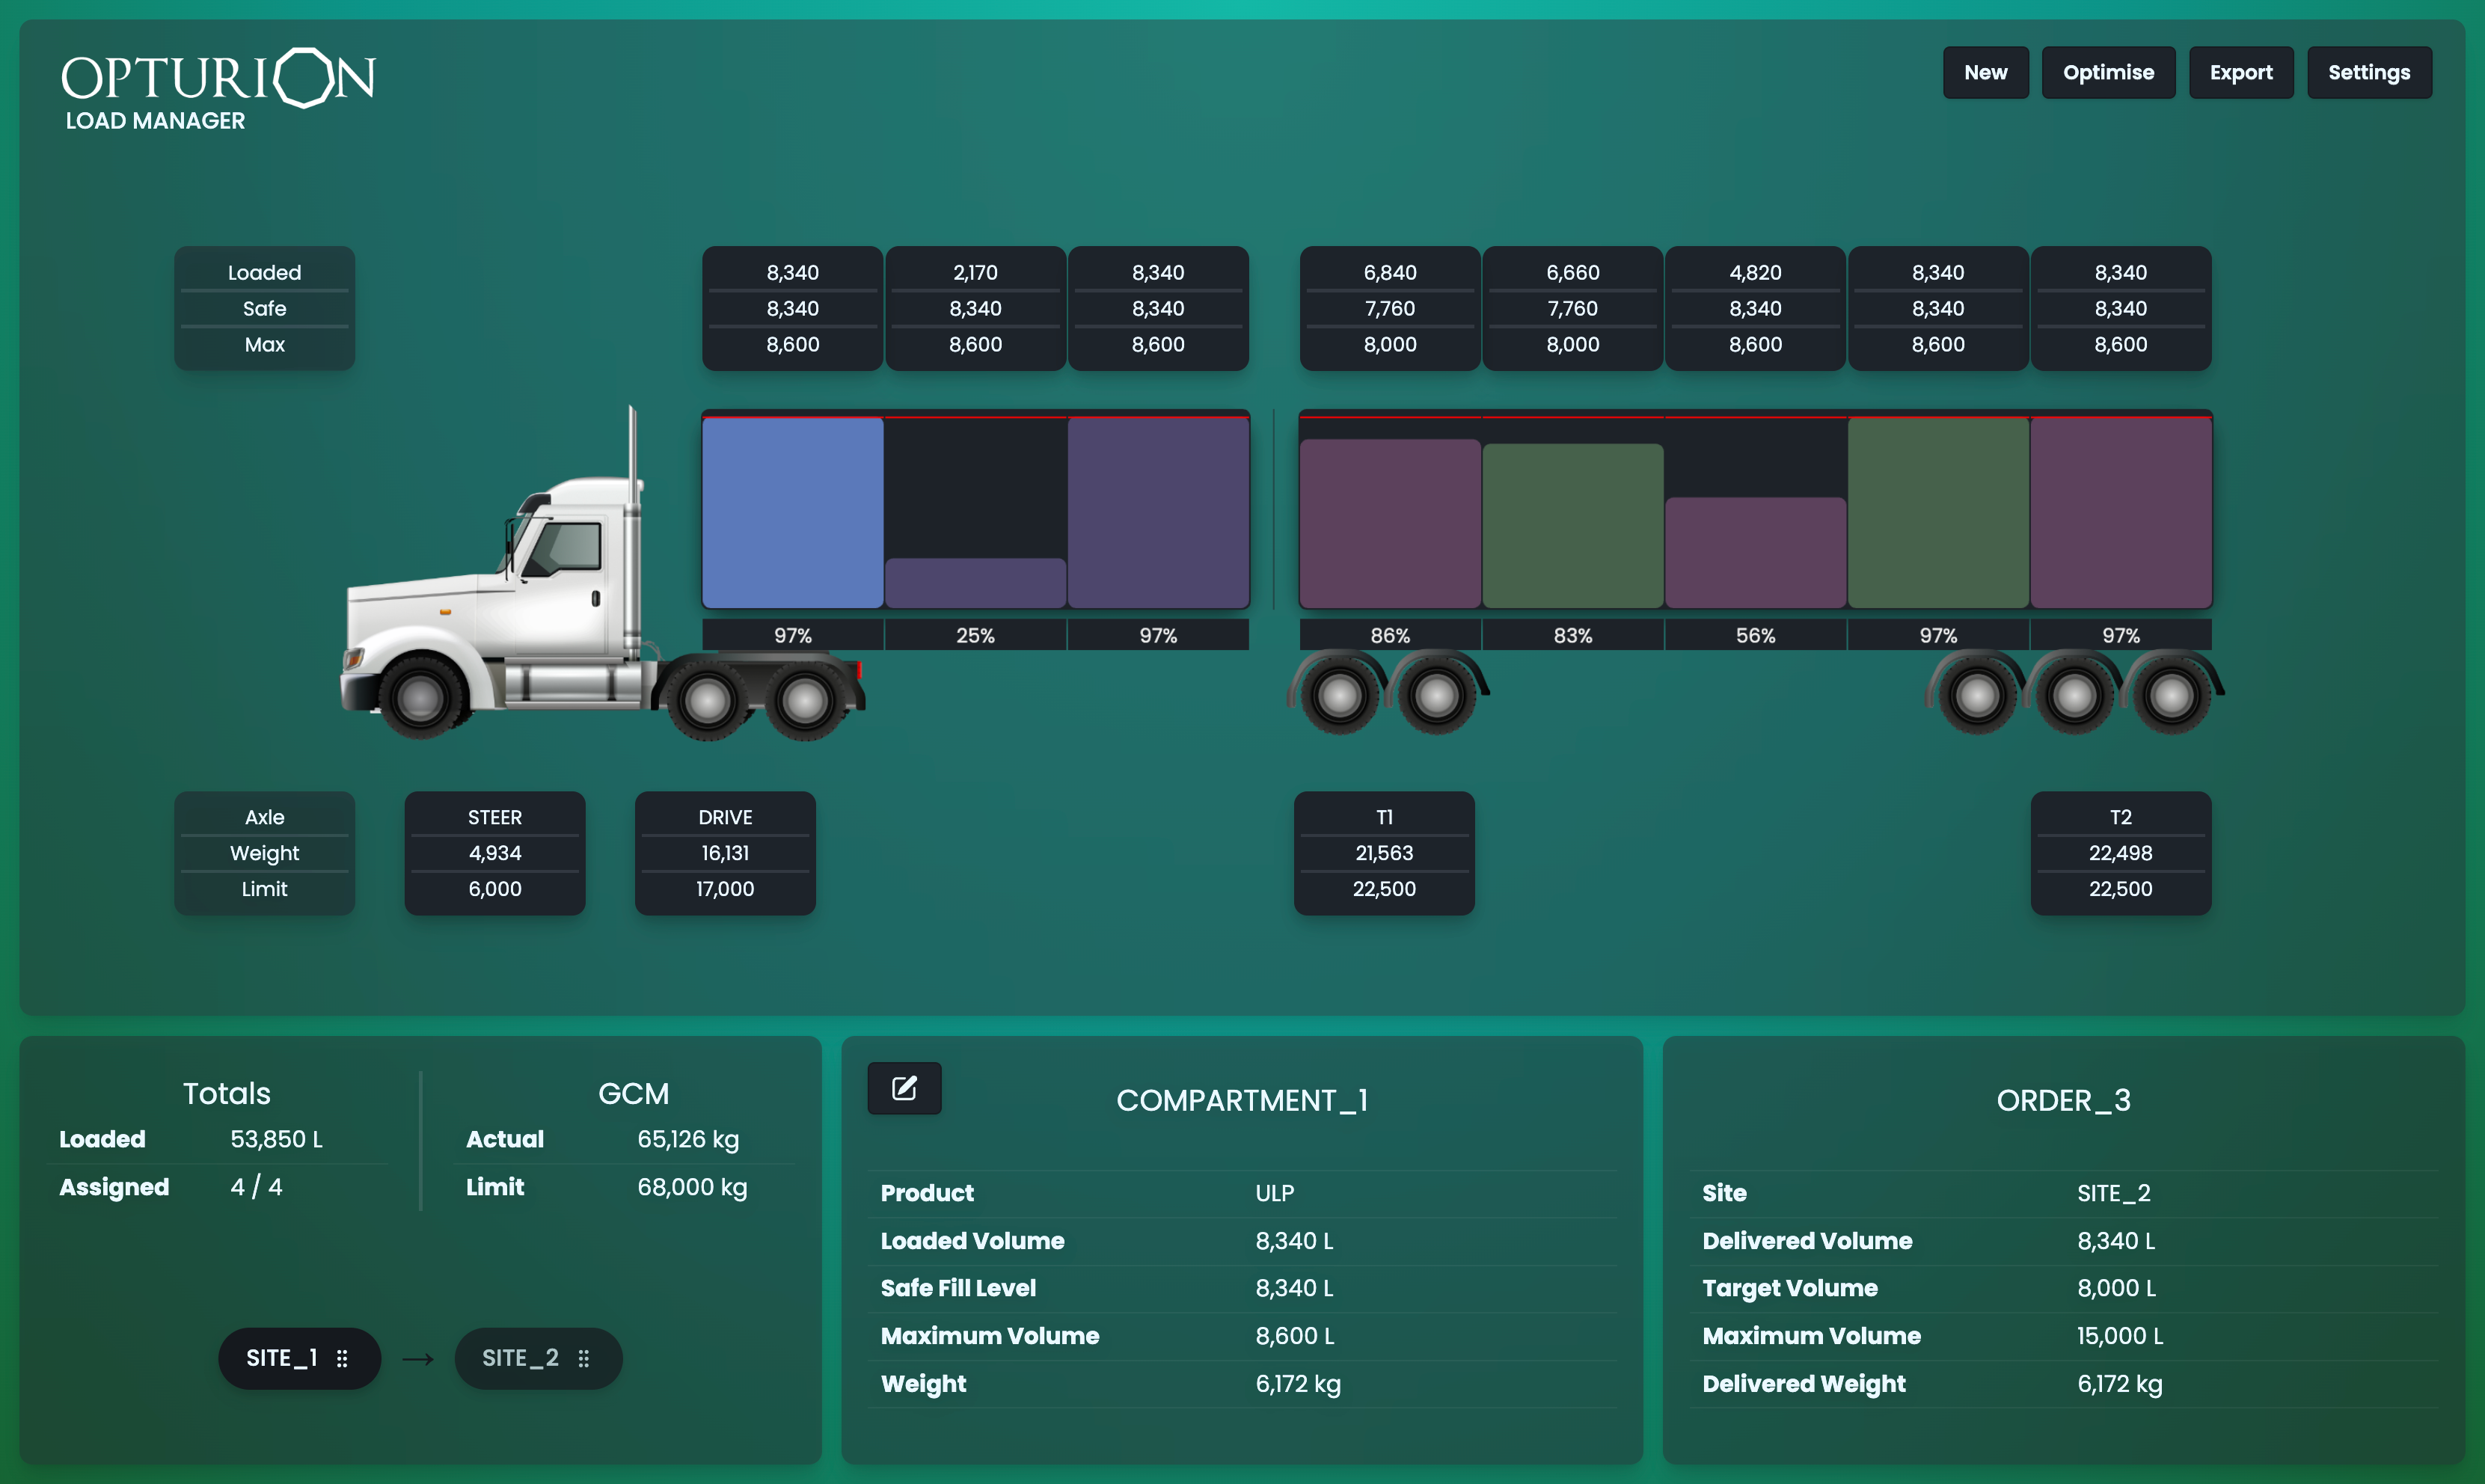
The load plan interface has five subsections. We describe each in the following sections.
2.1.1 Options Menu

Figure 4 shows the options menu. It provides the following options:
-
New
Click this button to clear the current solution and return to the dashboard shown in Figure 1.
-
Optimise
Click this button to re-optimise the scenario. Re-optimisation discards any changes made to the solution, but preserves changes made to the scenario. For example, changes to assigned volumes will be discarded but any changes to the Settings or re-ordering of the delivery sequence will be preserved.
-
Export
Click this button to export the current solution to an Excel workbook and download it.
-
Settings
Click this button to open the Settings menu. This is shown in Figure 5.
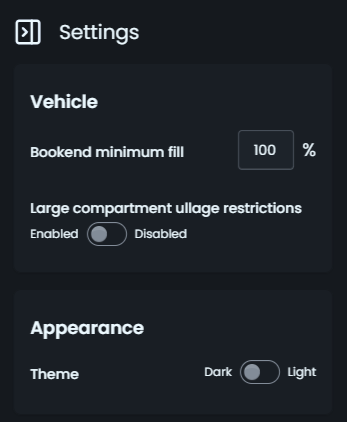
Figure 5: Settings menu. This lets you control:
-
Bookend Minimum Fill Percentage
The minimum fill percentage for bookend compartments. For an explanation of bookend compartments, see the “Opturion Load Manager – Data Formats and Web Service” document.
-
Large Compartment Ullage Restrictions
A toggle that controls whether the optimiser enforces a restriction on the amount of ullage in large compartments. This is enabled by default. For a more detailed explanation of ullage restrictions, see the “Opturion Load Manager – Data Formats and Web Service” document.
-
Theme
A toggle that controls whether the dashboard uses a light or dark theme.
-
2.1.2 Visualisation
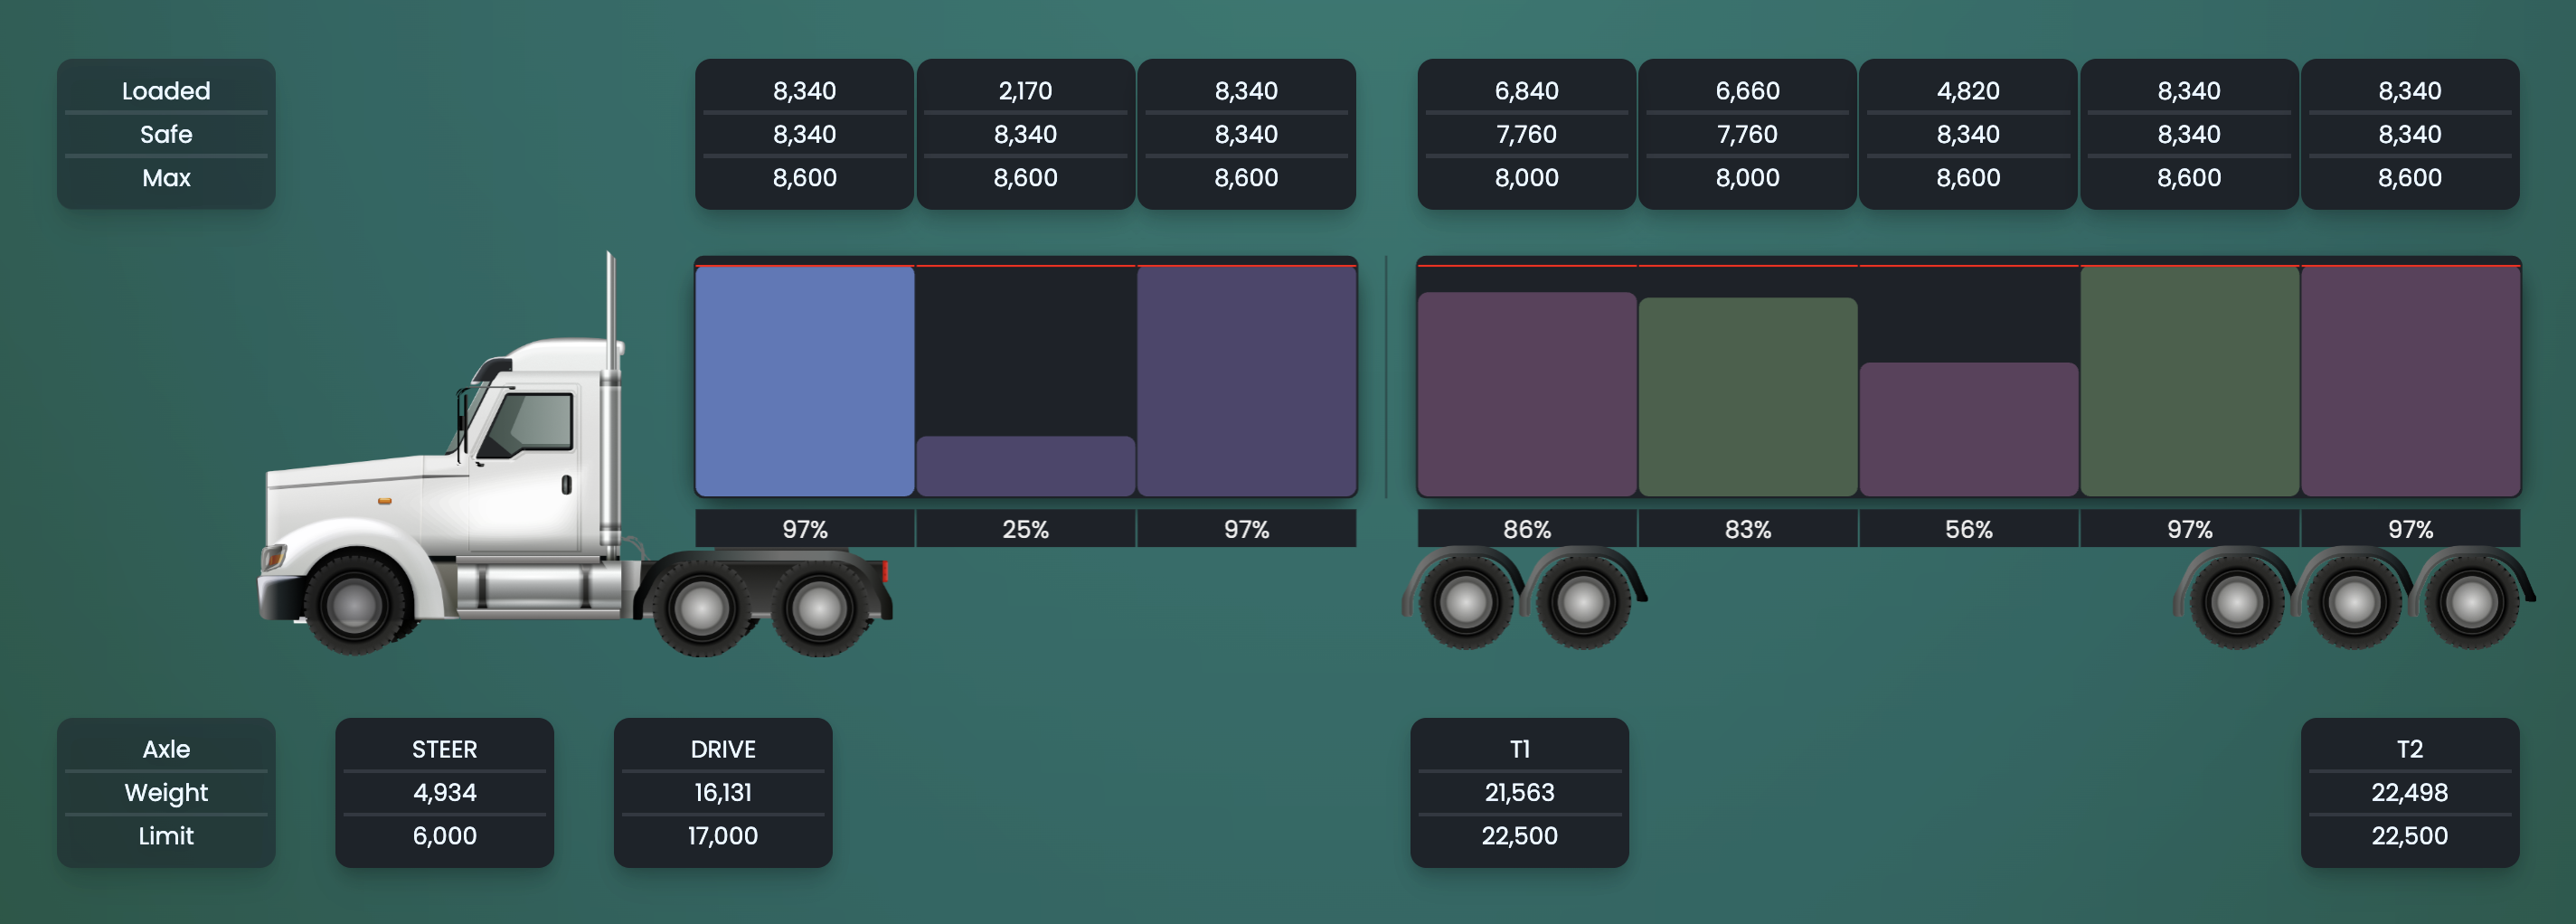
Figure 6 shows a close-up of the visualisation. It contains the following information:
-
Axle Weights:
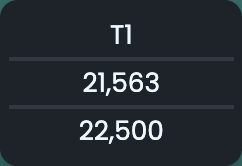
Figure 7: Axle weights example.Figure 7 is an example of how the axle weights are shown in the visualisation. Figure 6a shows the KPI labels and Figure 6b shows the values for those KPIs. Here we can see that axle “T1” has been assigned a weight of 22,498 out of a limit of 22,500.
-
Compartments:
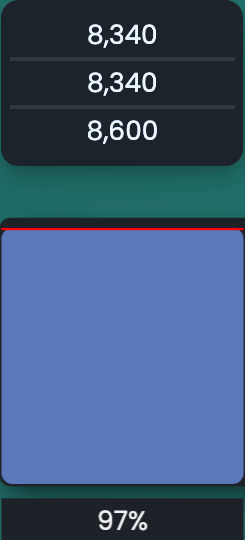
Figure 8: Compartment visualisation. Figure 8 is an example of how the compartments are shown in the visualisation. It consists of the following:
-
Fill Level Percentage:
The top label provides the current fill level as a percentage of maximum capacity. In this example the compartment is filled to 97% of its safe maximum capacity.
-
Add / Subtract Product:
The + and − buttons let you increase or decrease the fill level in the compartment in increments of 100 litres. Finer adjustments to fill levels can be made using the Compartment Summary table.
-
Fill Level:
The coloured component visualises the current fill level of the compartment. Each order is shown using a different colour, with all compartments containing the same order using the same colour.
Figure 6 shows an example with four orders, where some of the orders have been split across multiple compartments.
Selecting a compartment will modify the data in the compartment and order summary tables.
-
Red and Yellow Line:
The red and yellow lines represent the safe fill level and the minimum compartment volume respectively.
Note that the minimum compartment volume is a property of the order assigned to a compartment rather than of the compartment itself.
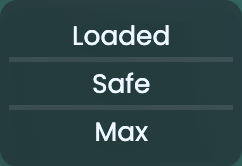
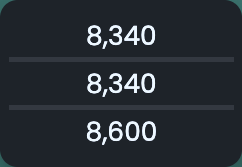
Figure 9: Axle weights example.Figure 9 shows an example of how the compartment levels are represented in the visualisation. Figure 8a shows the KPI labels and Figure 8b shows the values of those KPIs. Here we can see that the compartment has been assigned a load of 8,340, where its safe fill level is 8,340 and its maximum fill level is 8,600
-
2.1.3 Site Summary
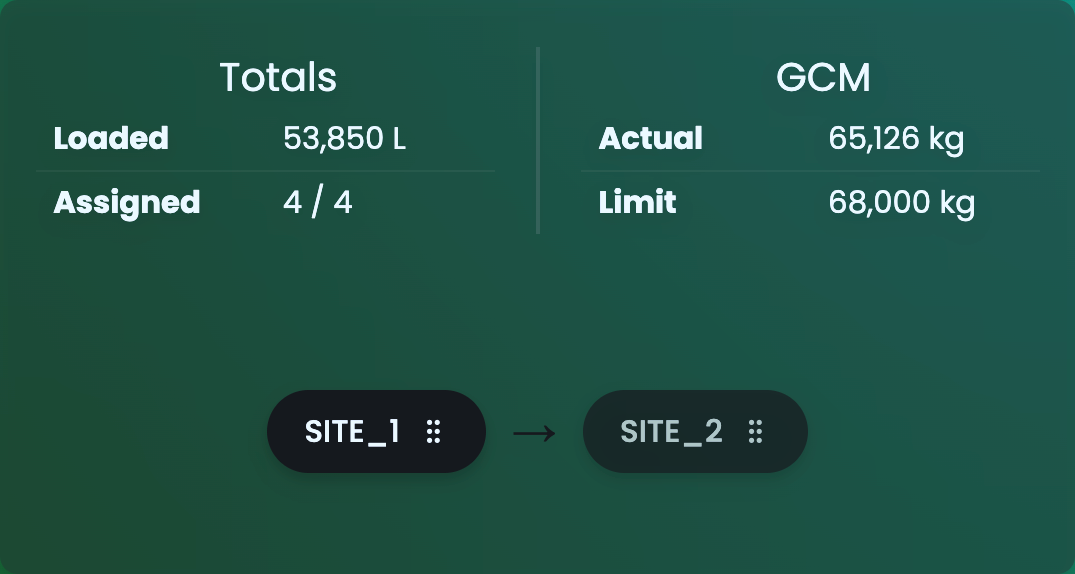
Figure 10 shows the site summary table. This table summarises the delivery totals and gross combined mass (GCM) limits for a site in the delivery schedule.
The current site is highlighted. A different site can be selected by clicking on that site’s label.
The sequence in which sites are visited in the delivery schedule can be changed by dragging and dropping the site labels into the desired order. Note that this will probably lead to compliance violations and should be used in conjunction with a re-optimisation.
2.1.4 Compartment Summary
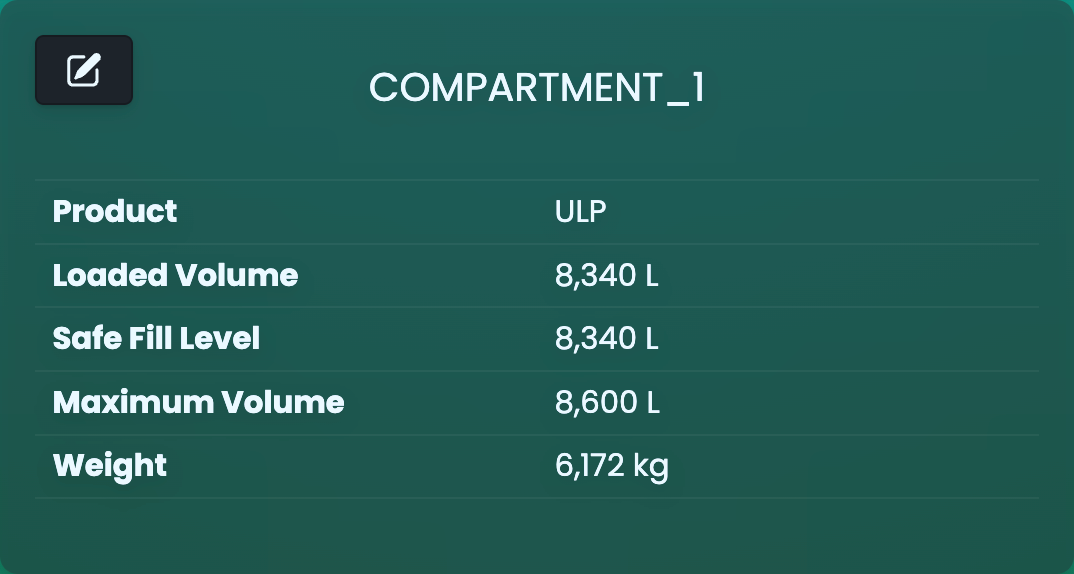
Figure 10 shows the compartment summary table. This table contains KPIs for the selected compartment. Other compartments can be selected using the visualisation.
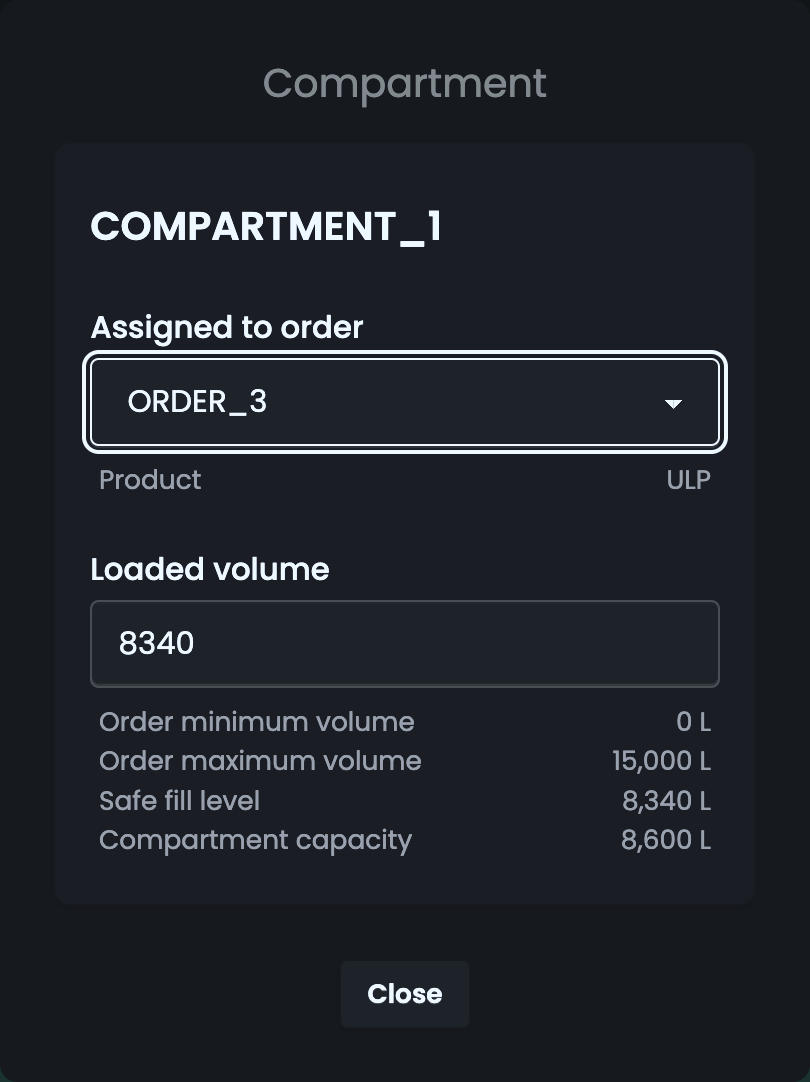
Clicking the edit icon in the top left of the table will open the sub-menu shown in Figure 12. This lets you make manual adjustments to the contents of the compartment. Note that this can lead to compliance violations.
2.1.5 Order Summary
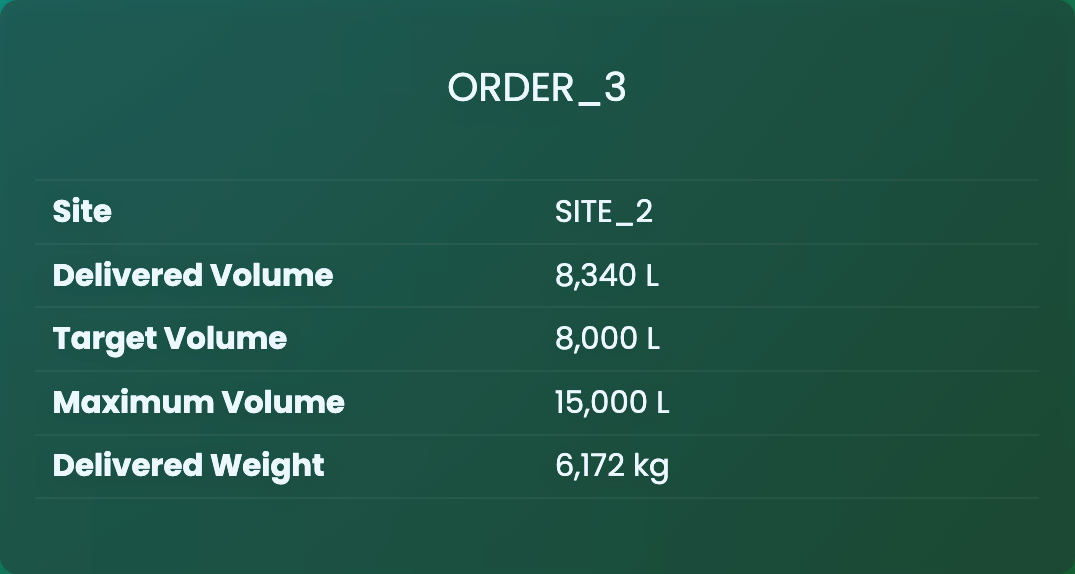
Figure 13 shows the order summary table. This table summarises the KPIs for the currently selected order. Other orders can be selected using the visualisation.
2.1.6 Compliance Violations
As you make modifications to the solution returned from the OLM, they can violate some of the compliance constraints. These violations are shown in the interface using a combination of red highlighting and warning labels. Figure 14 shows an example of this.
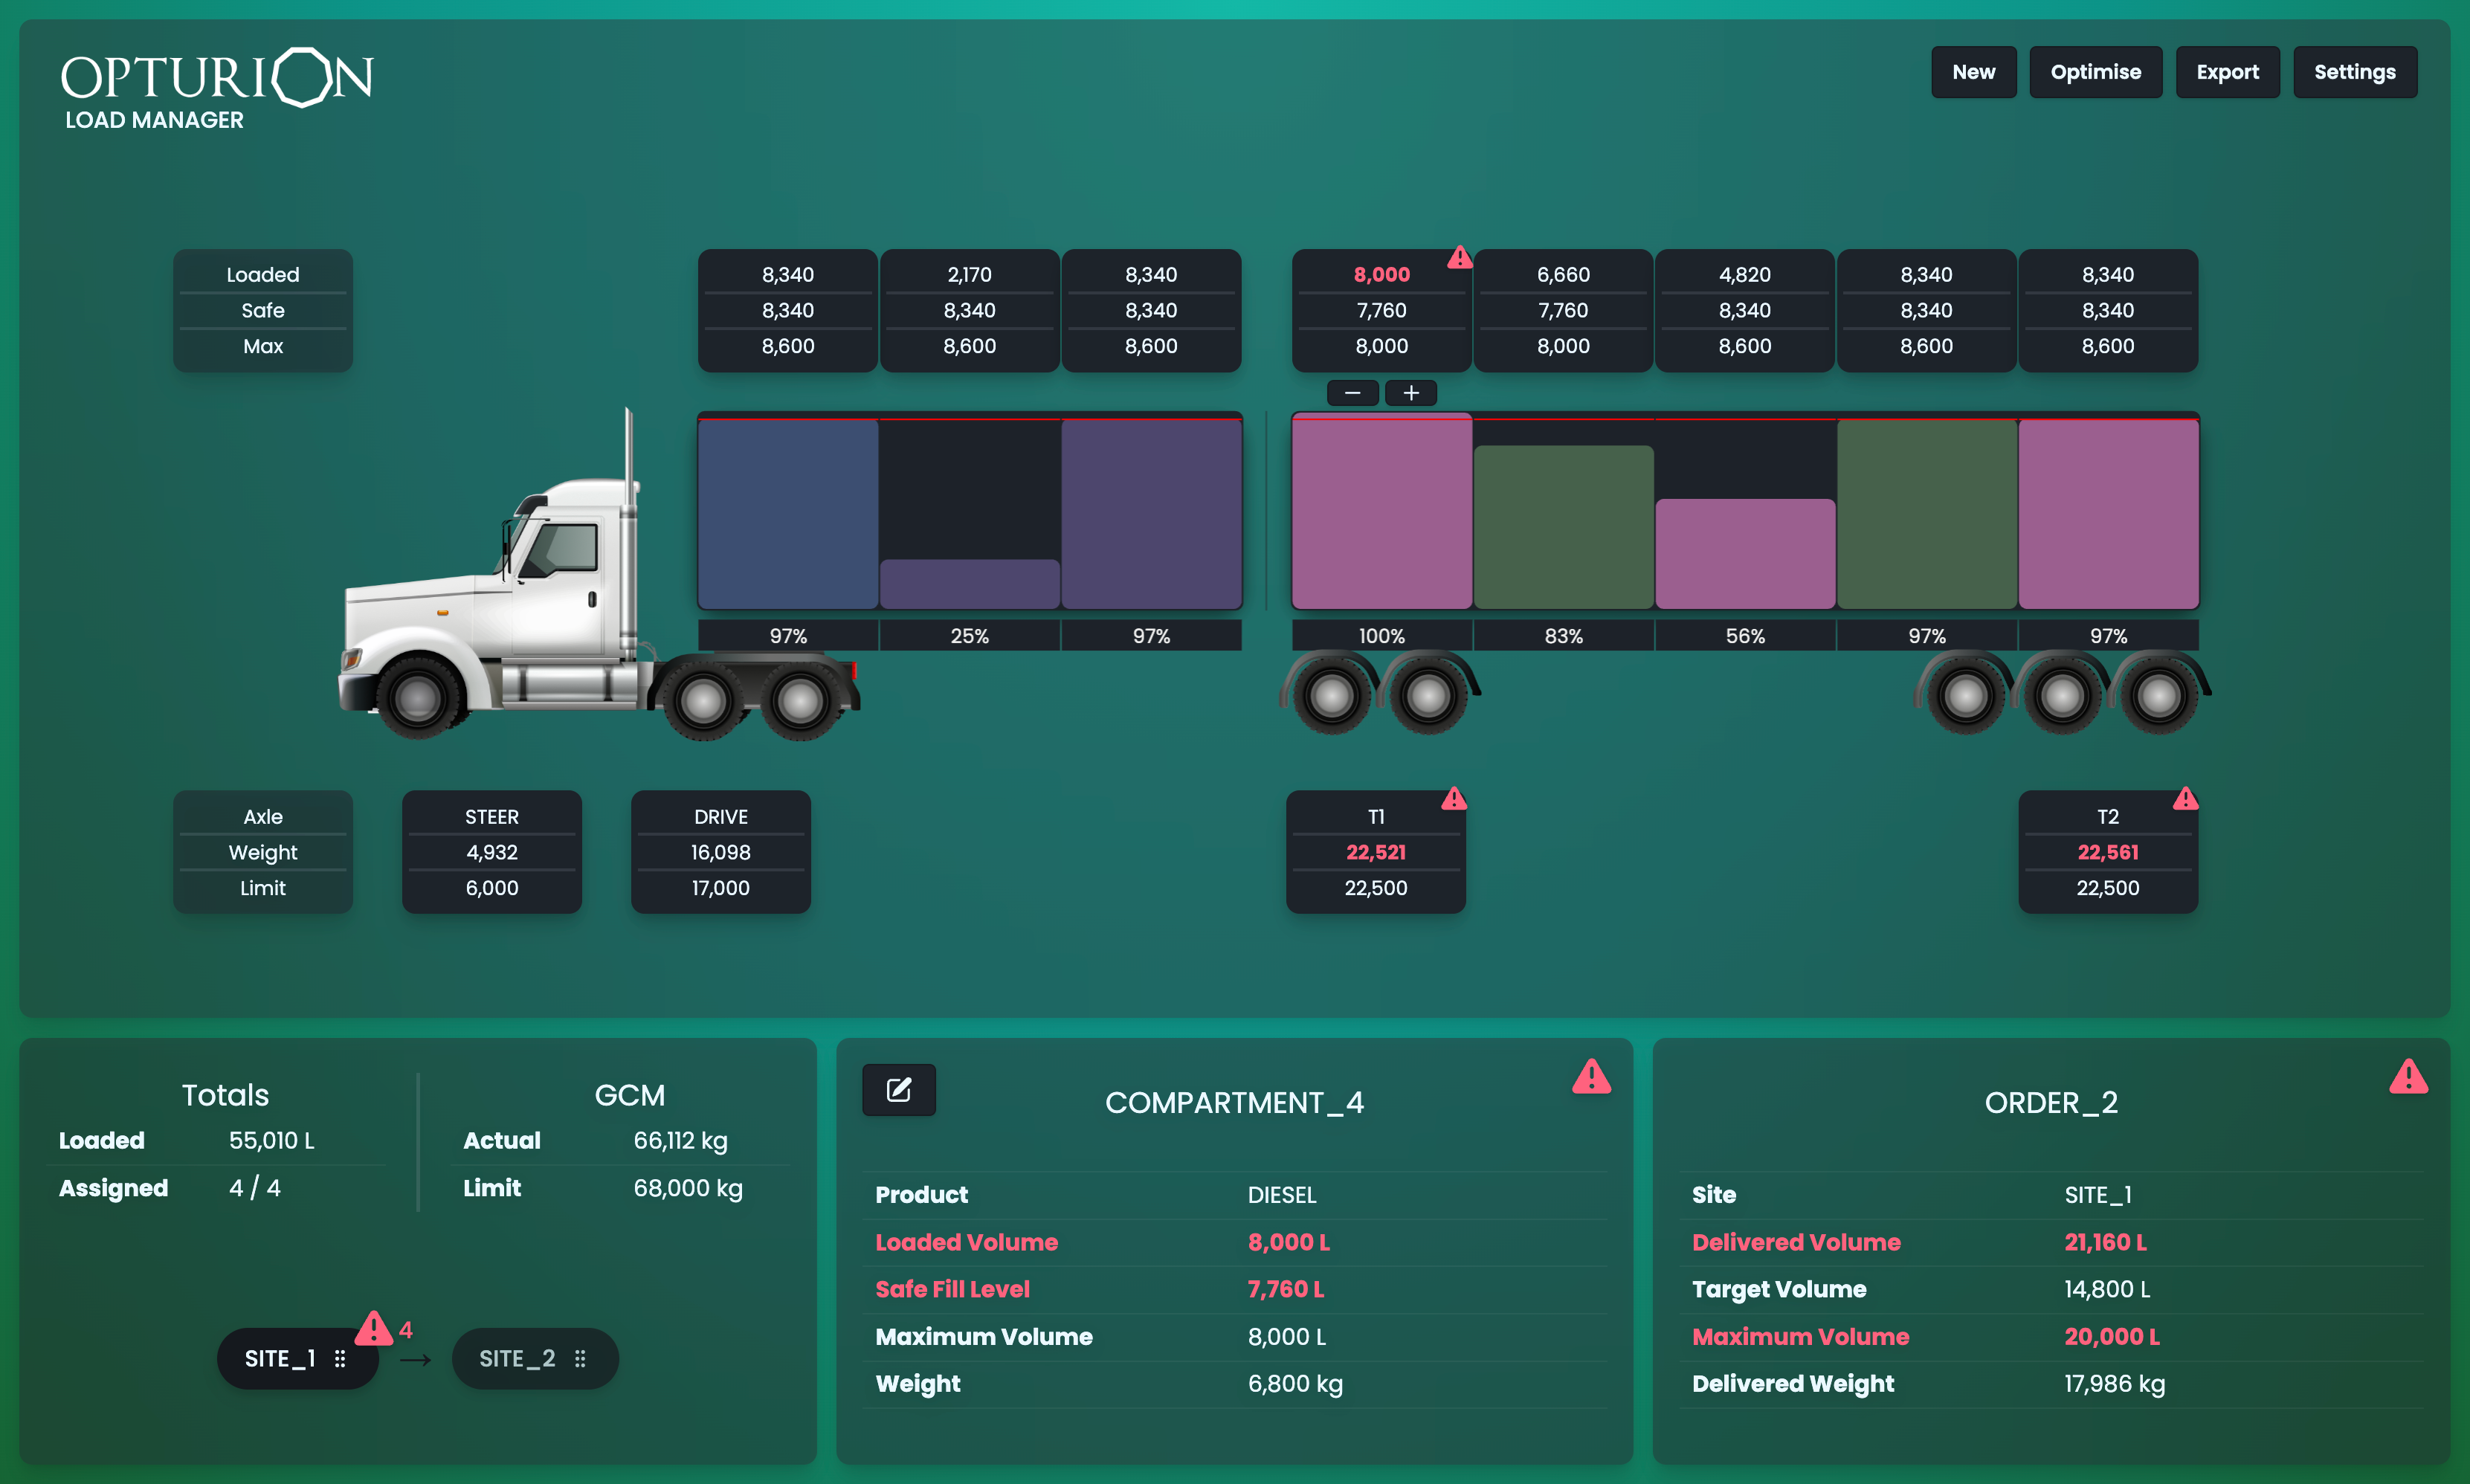
Hovering over the icons will cause a pop-up describing the violation to appear. For example, hovering over the warning attached to the “T1” axle group will show the error in Figure 15.