

3.1 Basic Example
Download Workbook: pdp_base.xlsx.
Opturion Freight is a small (and fictitious) transport company operating across greater Melbourne with a fleet of five trucks. Each day, orders must be picked up from their depot and delivered to customers around the city.
The orders have varying weights and volumes. Every assignment of orders to trucks must ensure that the capacities of the trucks are never exceeded.
The depot is open from 06:00 to 18:00. Each vehicle must start and finish its day at the depot. Furthermore, customer locations may have their own operating hours, outside of which Opturion Freight cannot deliver.
Currently, the owner of Opturion Freight plans each day’s pickups and deliveries by hand the evening before. This is a time-consuming process and the owner feels that potential efficiencies are being missed.
In these examples, we are going to automate the creation of the daily transport plan for Opturion Freight using DTO. We begin by creating an input workbook for use with DTO.
3.1.1 Excel Data Conventions
Before stepping through the input to the optimiser, we describe how various types of data required by the optimiser are represented in Excel.
-
Identifiers
Entities in the optimiser input, such as orders, locations and vehicles, must have an identifier (Id) that uniquely identifies them.These identifiers are used to refer to those entities in the optimiser output.
Identifiers are represented using text or number cells in Excel. Their names must satisfy the following rules:
- They must contain at least one character.
- They must not contain the semicolon (“;” ) character.
Identifiers are not case sensitive or “underscore” sensitive. Whitespace in the identifier name is not significant. For example: “S1”, “s1” and “S_1” are all treated as a reference to the same entity by the optimiser.
•Times
In Excel, times are stored as decimal numbers, where 0 is 00:00 and 1 is 24:00.The integer component of the decimal represents a 24-hour period and is used to represent times greater than 23:59. When using this representation, it is useful to think of the integer component as the day on which the time occurs, with times less than 24:00 occurring on day zero. For example, 1.50 would be 36:00, or 12:00 on the second day.
Cells containing times may be formatted and displayed in a variety of ways by Excel. For example, hh:mm, d hh:mm or h:mm AM/PM and so forth. Times may be given to the optimiser in any of the Excel time formats.
Excel automatically converts times entered on the keyboard into decimal format. For example, if 06:00 is entered into a cell then the value of that cell is 0.25 and its format is set to hh:mm.
Note that schedules are generated to the minute by the optimiser. Times and durations below a minute are rounded up.
•Durations
In Excel, durations are like times and are stored as decimal numbers.Cells containing durations may be formatted and displayed in a variety of ways. For example, [hh]:mm, hh:mm and so forth. Durations may be given to the optimiser in any of the Excel formats.
-
Addresses
Addresses must be contained in a single cell. If they are split across multiple columns, then you can use an Excel formula like the following to combine the address information into a single cell.A B C D Street Number Street Postcode Address 12 Example St 3000 =A21&“ ”&B21&“ ”&C21&“, Victoria, Australia”Here the “&” character is used to combine the cell values with either spaces or the additional information that the address is in “Victoria, Australia”. While the above example only joins three cells to form an address, it can be extended for any number of cells. This formula evaluates to “12 Example St 3000, Victoria, Australia”.
Address information is only needed if you do not have latitude and longitude coordinates for locations in your input. In that case, addresses need to be converted into their corresponding latitude and longitude. This is done using a process called geocoding.
Geocoding your input is done as a separate step before you run the optimiser. We describe how in the Geocoder section.
For the worked examples in this guide, the inputs have already been geocoded.
3.1.2 Optimiser Input
For this example, our Excel workbook contains four sheets. They are:
-
General
This sheet lets you control the settings used by the optimisation. It has two columns: the Parameter column names an optimiser parameter whose value you want to set, and the Value column contains the value for that parameter.Here, we set two parameters.
- Scenario Name
This is an optional parameter that lets you give a name to the scenario. If a name is provided, then it is used in the output. - Iterations
This is an optional parameter that lets you set the number of iterations that the optimiser will run for. Using a greater number of iterations may yield a better solution, at the cost of a longer runtime. If this parameter is not specified, then the optimiser defaults to using 3000 iterations.
- Scenario Name
-
Locations
This sheet contains details of the locations used in the scenario. It has the following columns:- Id
The unique identifier for the location. - Name
The name of the location (e.g. a site or store name). This may be left blank. - Address
The street address of the location. - Longitude
The longitude, in decimal degrees, of the location. - Latitude
The latitude, in decimal degrees, of the location. - Opening Time
The opening time of the location. No vehicle can make pickups or deliveries at the location before this time. - Closing Time
The closing time of the location. No vehicle can make pickups or deliveries at the location after this time.
Opening Time and Closing Time must be entered as Excel times.
3.Orders
This sheet contains details of the orders that we want to assign to vehicles in the fleet. It has the following columns:- Id
The unique identifier for the order. - Pickup Location
The identifier of the location where the order will be picked up. - Delivery Location
The identifier of the location where the order is to be delivered. - Weight
The weight of the order. - Volume
The volume of the order.
It is not necessary to have both Weight and Volume columns in the Orders sheet, but at least one of them must be present.
The units of measurement used in the Weight and Volume columns should be the same as those used for the vehicle capacities.
- Id
-
Fleet
The sheet contains details of all the vehicles in our fleet. It has the following columns:- Id
The unique identifier for the vehicle. - Start Location
The identifier of the location where the vehicle begins its route. If blank, then the vehicle begins its route at the first pickup location. - Finish Location
The identifier of the location where the vehicle must end its route. If blank, then the vehicle ends its route at the last delivery location. - Maximum Weight
The maximum weight of orders allowed on the vehicle at any time. - Maximum Volume
The maximum volume of orders allowed on the vehicle at any time. - Earliest Start Time
The earliest time that the vehicle can begin work.
- Id
The units of measurement used in the Maximum Weight and Maximum Volume columns should be the same as those for the order Weight and Volume columns.
Earliest Start Time is entered as an Excel time.
For further details, such as additional sheets or columns not described here, refer to Opturion Dynamic Transport Optimiser – Data Formats
3.1.3 Running The Optimiser
In this guide, we will run the optimiser using the dashboard interface. Instructions for accessing the dashboard interface can be found here. After logging in, you will see the screen in Figure 11.
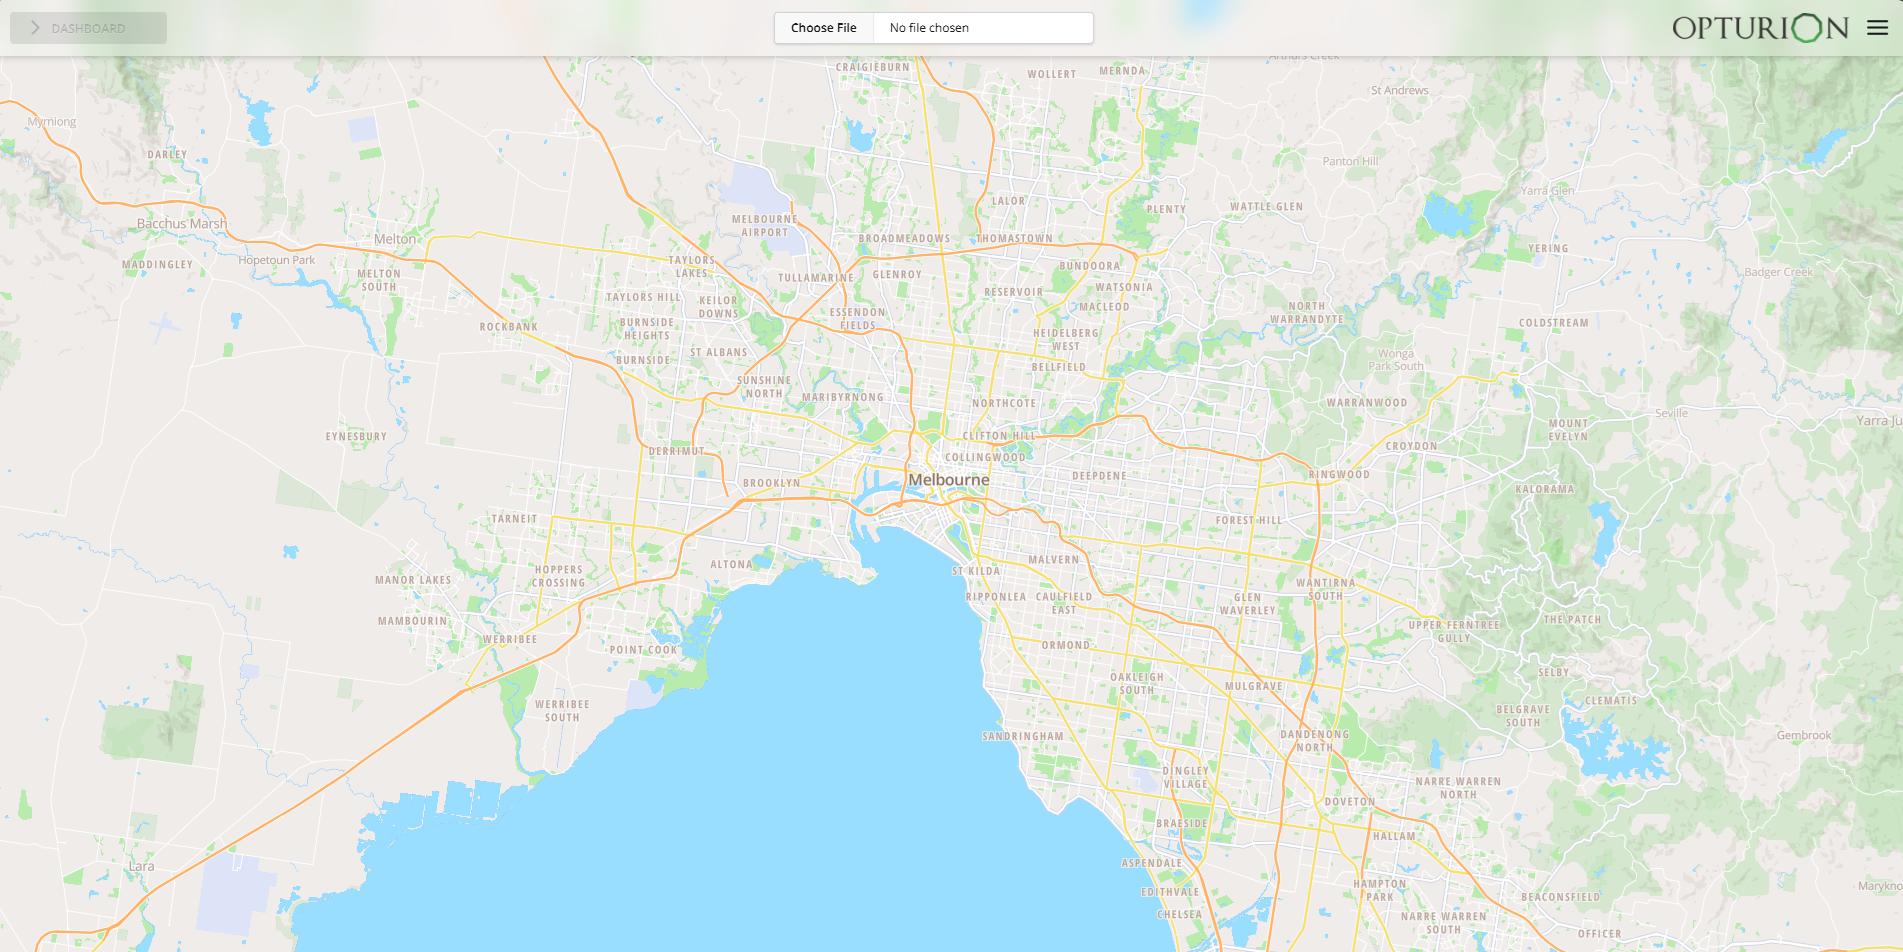
To optimise a scenario, it must first be uploaded to the DTO by clicking the Load Scenario button and selecting the workbook file. Once the scenario has loaded, its locations are plotted on the map. In Figure 11, the red squares on the map show the locations. The scenario is now ready for optimisation. The optimisation can be started by clicking the Solve button in the top left corner of the screen. The optimiser will run until it has completed all the iterations set in the General sheet of the workbook.
Once the optimiser has started, the dashboard interface displays solution KPIs and routes for the vehicles. The KPI graph is plotted against the number of iterations. It lets you see how the solution improves as the optimisation proceeds. Plots for individual KPIs can be turned on or off using the check boxes in the top right corner of the screen. This is shown Figure 12.
When a solution has been found by the optimiser, you can view a vehicle’s route by selecting it from the drop-down menu. Clicking on a location, indicated by a square on the map, will open an information box containing details about what is scheduled to occur at that location. Selecting the Orders option from the drop-down menu will display all locations on the map.
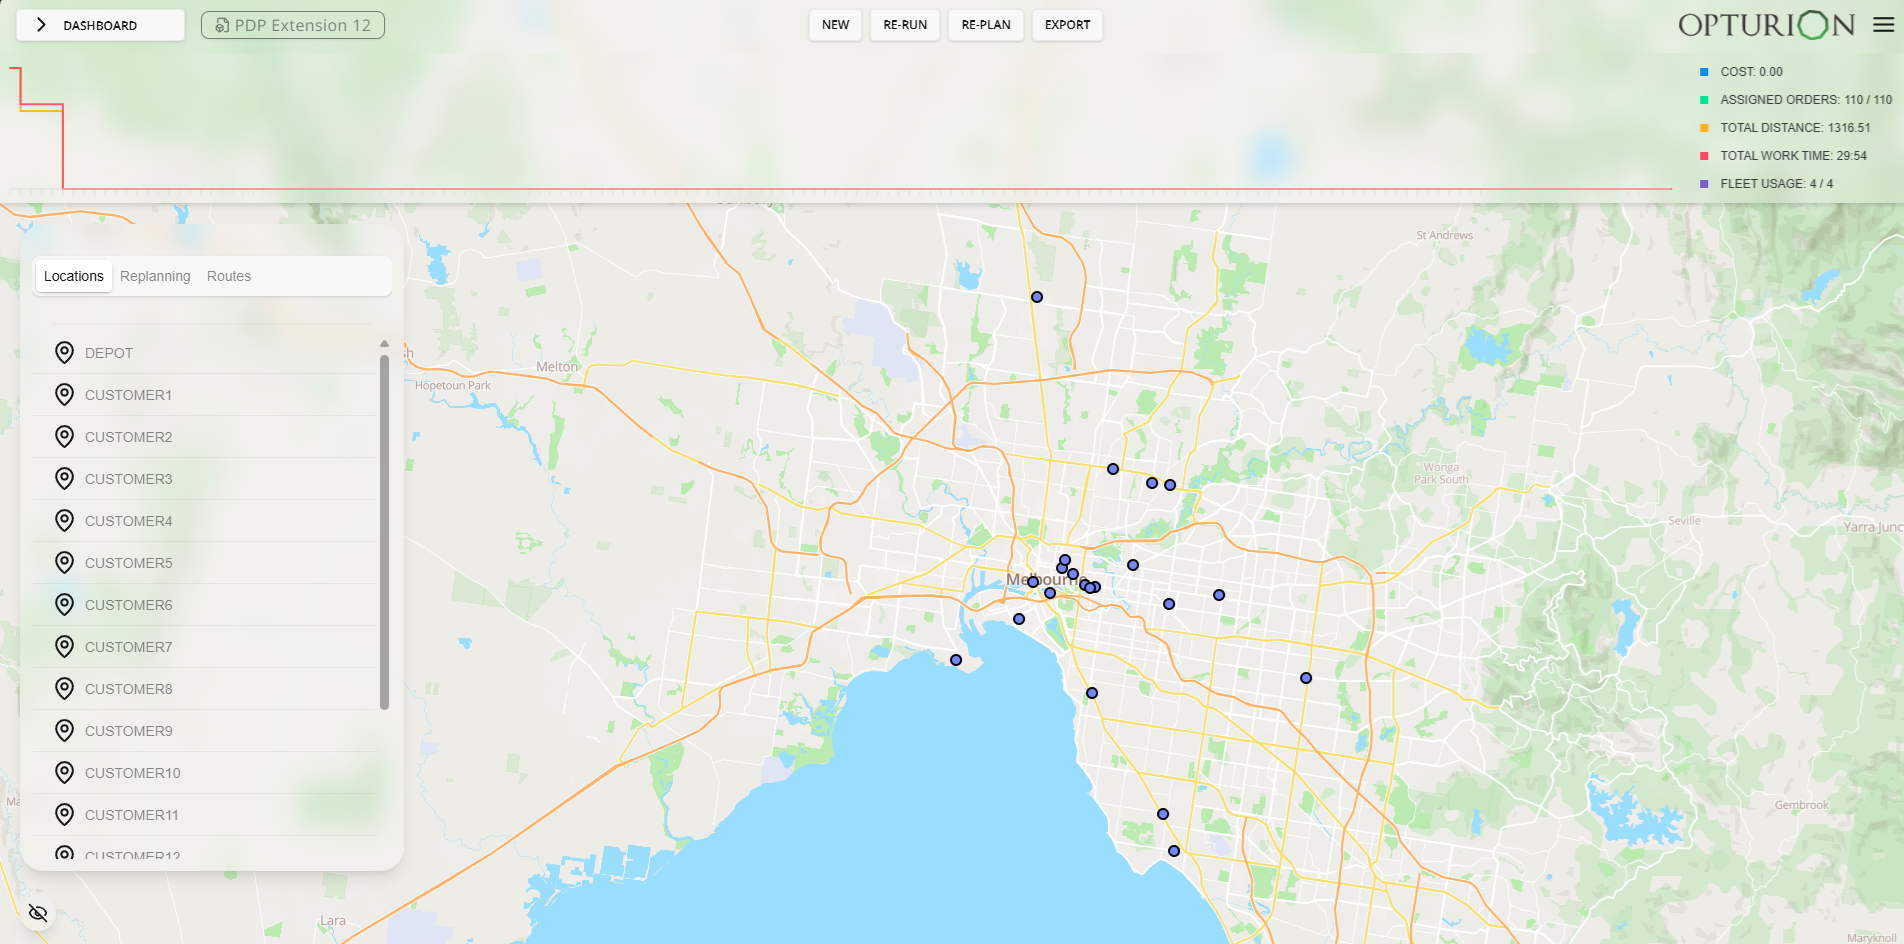
When the optimiser has finished, the Export Scenario button will become active. Clicking this button to download an Excel workbook containing the solution found by the optimiser.
You can halt the optimisation at any stage by clicking the Stop button. This will also cause the Export Scenario button to become active and you can download the best solution the optimiser found before it was halted.
3.1.4 Solution Excel
After you have downloaded the solution, you will have an Excel workbook containing four sheets. These are:
- Solution Summary
This sheet contains summary KPIs for the entire solution. Table 2 shows a subset of this. -
Runsheet
This sheet contains a detailed breakdown of each vehicle’s schedule. Each row represents a stop and contains the following:- Vehicle Id
The identifier of the vehicle. - Load
The load number. For this scenario, this is not enabled. It will be relevant for Extension 7: Batched Loads. - Stop Number
The stop number. - ETA
The estimated time of arrival at the stop. - ETD
The estimated time of departure from the stop. - Stop
The type of the stop: START, FINISH, PICKUP, DELIVERY or BREAK. - Order
If the stop type is PICKUP or DELIVERY, then this is the identifier of the order that is being picked up or delivered. - Address
The identifier of the location where the stop occurs. - Street Address
The address of the location where the stop occurs. - Volume
The volume on the vehicle at the departure from the stop. - Delta Volume
For PICKUP or DELIVERY stops, the change in volume at the stop. - Weight
The weight on the vehicle at the departure from the stop. - Delta Weight
For PICKUP or DELIVERY stops, the change in weight at the stop. - Transit Time
The travel time between the previous and current stop. If the transit time is zero, then this cell is blank. - Transit Distance
The travel distance between the previous and current stop. If the transit time is zero, then this cell is blank.
Vehicle Id Load Stop Number ETA ETD Stop Order Address Street Address Volume Delta Volume Weight Delta Weight Transit Time Transit Distance Vehicle1 0 6:56 START DEPOT 18 Kavanagh St Southbank Vehicle1 1 1 6:56 6:56 PICKUP Order8 DEPOT 18 Kavanagh St Southbank 4 4 320 320 Vehicle1 1 2 7:00 7:00 DELIVERY Order8 CUSTOMER8 201 SPENCER ST 0 -4 0 -320 0:04 2.11 Vehicle1 2 3 7:05 7:05 PICKUP Order17 DEPOT 18 Kavanagh St Southbank 3 3 300 300 0:05 2.27 Vehicle1 2 4 7:05 7:05 PICKUP Order11 DEPOT 18 Kavanagh St Southbank 5 2 420 120 Vehicle1 2 5 7:05 7:05 PICKUP Order9 DEPOT 18 Kavanagh St Southbank 6 1 490 70 Vehicle1 2 6 7:05 7:05 PICKUP Order16 DEPOT 18 Kavanagh St Southbank 12 6 690 200 Vehicle1 2 7 7:05 7:05 PICKUP Order14 DEPOT 18 Kavanagh St Southbank 13 1 702 12 Vehicle1 2 8 7:12 7:12 DELIVERY Order11 CUSTOMER11 Station St, Sandringham 11 -2 582 -120 0:07 4.09 Vehicle1 2 9 7:18 7:18 DELIVERY Order16 CUSTOMER16 17 Walpole St, Kew VIC 3101 5 -6 382 -200 0:06 3.96 Vehicle1 2 10 7:28 7:28 DELIVERY Order17 CUSTOMER17 126 Union Rd, Surrey Hills 2 -3 82 -300 0:10 7.39 Vehicle1 2 11 7:35 7:35 DELIVERY Order14 CUSTOMER14 5/57 Station St, Camberwell 1 -1 70 -12 0:07 4.46 Vehicle1 2 12 7:43 7:43 DELIVERY Order9 CUSTOMER9 300 BRIDGE RD 0 -1 0 -70 0:08 5.44 Table 1: Runsheet example. - Vehicle Id
- Vehicle Summary
This sheet contains KPIs for each vehicle. - Load Summary
This sheet contains KPIs for each load.
| KPI | Value |
| Total Cost | 0 |
| Total Distance | 426.64 |
| Work Time | 09:18 |
| Transit Time | 09:18 |
| Assigned Orders | 20 / 20 |
| Fleet Usage | 2 / 5 |
Notice that in this solution we are underutilising the capacity of the vehicles. Also, each vehicle is only scheduled to work for half a day. This is because we have not assigned running costs to the vehicles. In this case, the optimiser cannot distinguish between solutions with less working time, fleet usage etc., because those solutions do not improve the cost. We will fix this in the next example by adding running costs to the fleet.