

2.2 Dashboard Interface
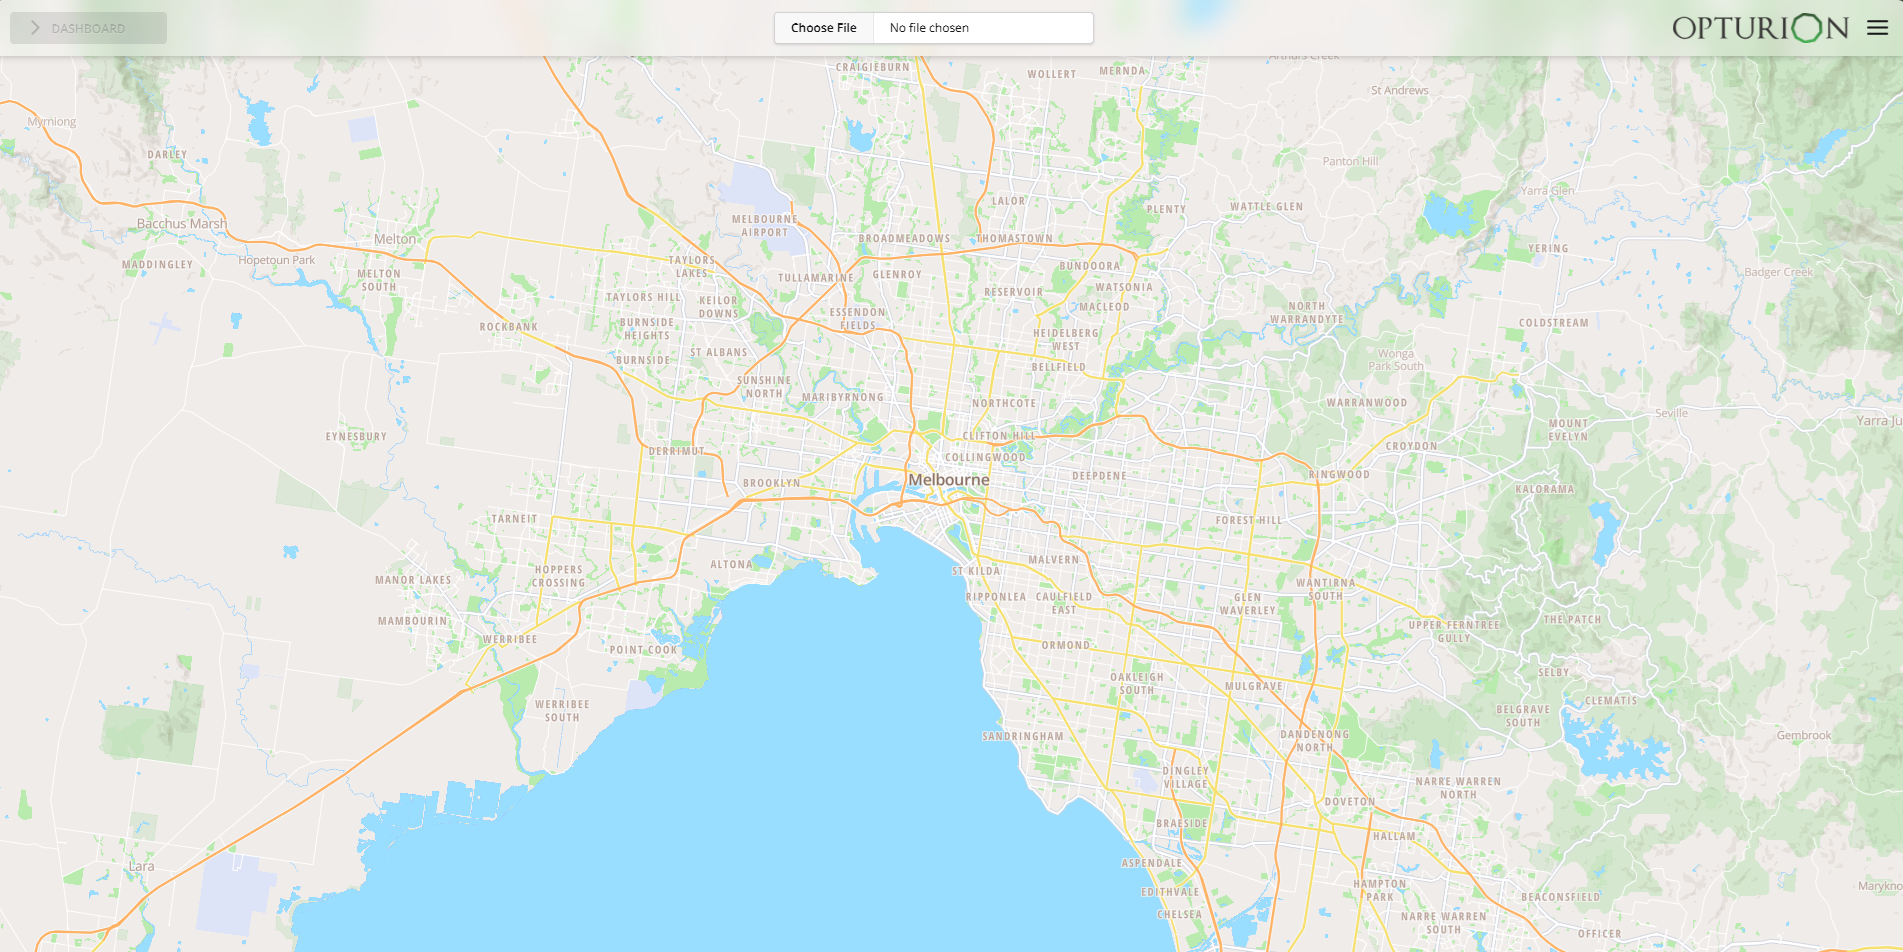
Figure 3 shows the dashboard control buttons.

The Choose File button lets you upload an input file in either the DTO-JSON or DTO-Excel input format. On a successful upload, the map is updated to display the locations in the input. Otherwise, a dialog box giving you the choice to cancel the upload or view the errors will be displayed. If you choose to view the errors, then a new window or tab will be opened in your browser and the errors displayed in it.
The Run button starts the optimisation. Once started, it changes into the Stop button, allowing you to stop the optimisation and obtain a solution.
If the Warnings button appears, then it means that the optimiser has detected potential problems with the scenario. These problems can cause orders to not be assigned or vehicles to not be used. Click the button to see what the potential problems are.
The Export button lets you download the solution as an Excel workbook.
Figure 6 shows a solution in the dashboard.
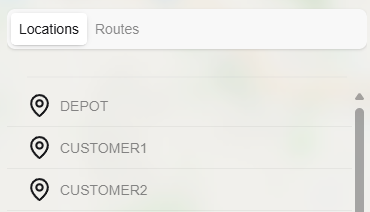
The map option menu (Figure 4) lets you select what is displayed on the map. Selecting the Locations option shows each location on the map. Blue markers show locations where all orders are assigned. Green markers show locations where there is at least one unassigned order. The other options in the drop-down let you display the route of each vehicle on the map.
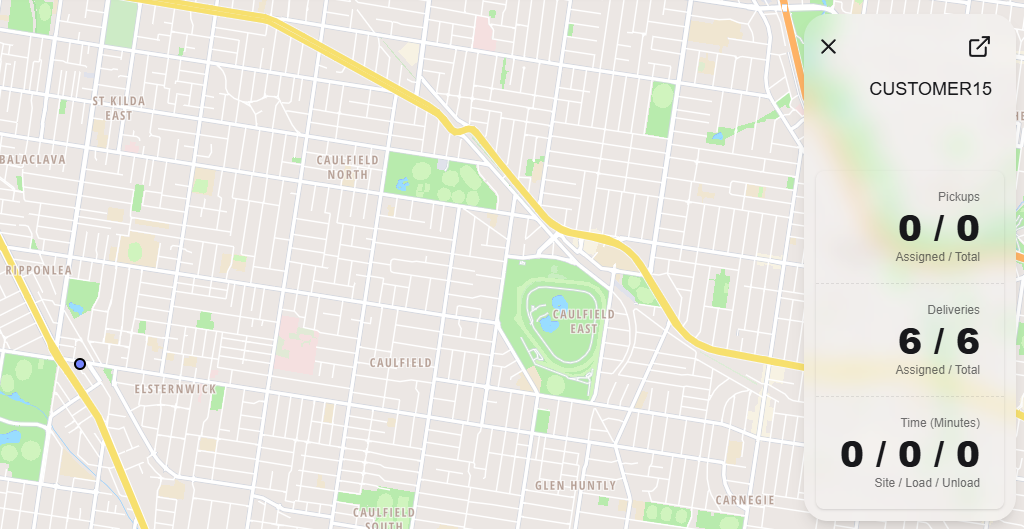
Click on a map marker to open an information box that contains details of what is scheduled to occur at that location. An example of this is shown in Figure 5.
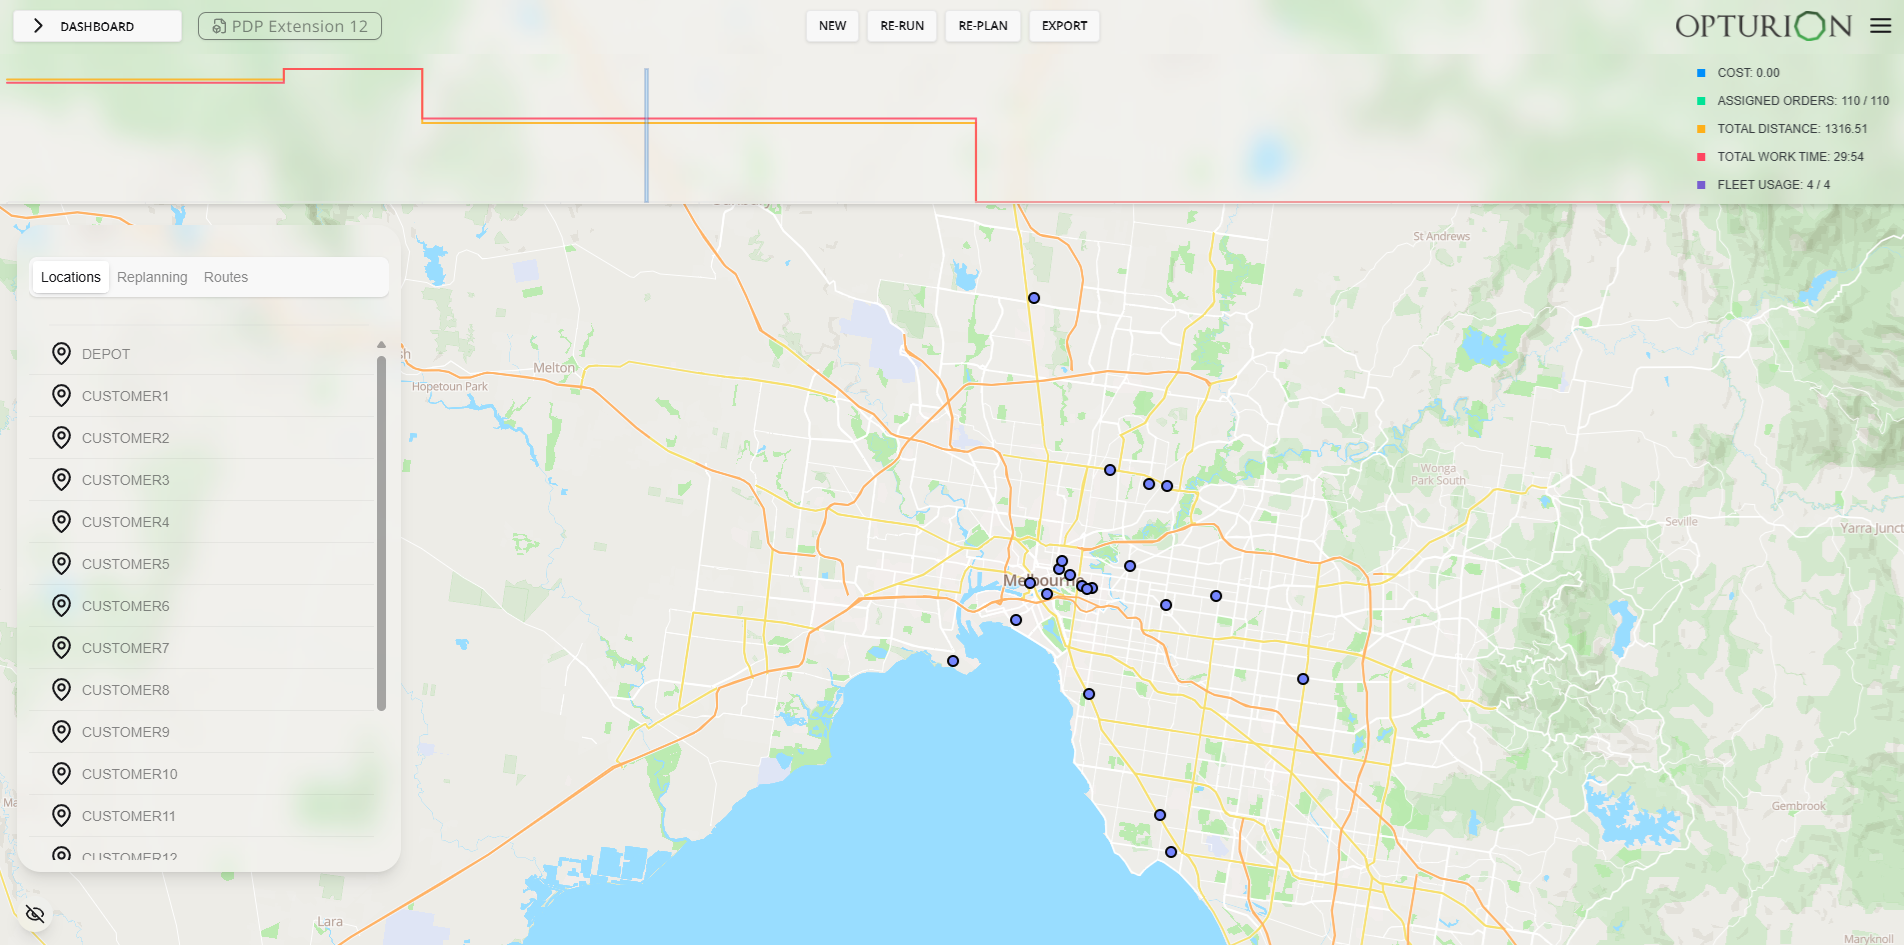
Key performance indicators (KPIs), like total cost and fleet usage, are shown in the top right corner. The graph along the top of the window shows the KPI values as the optimisation progresses.